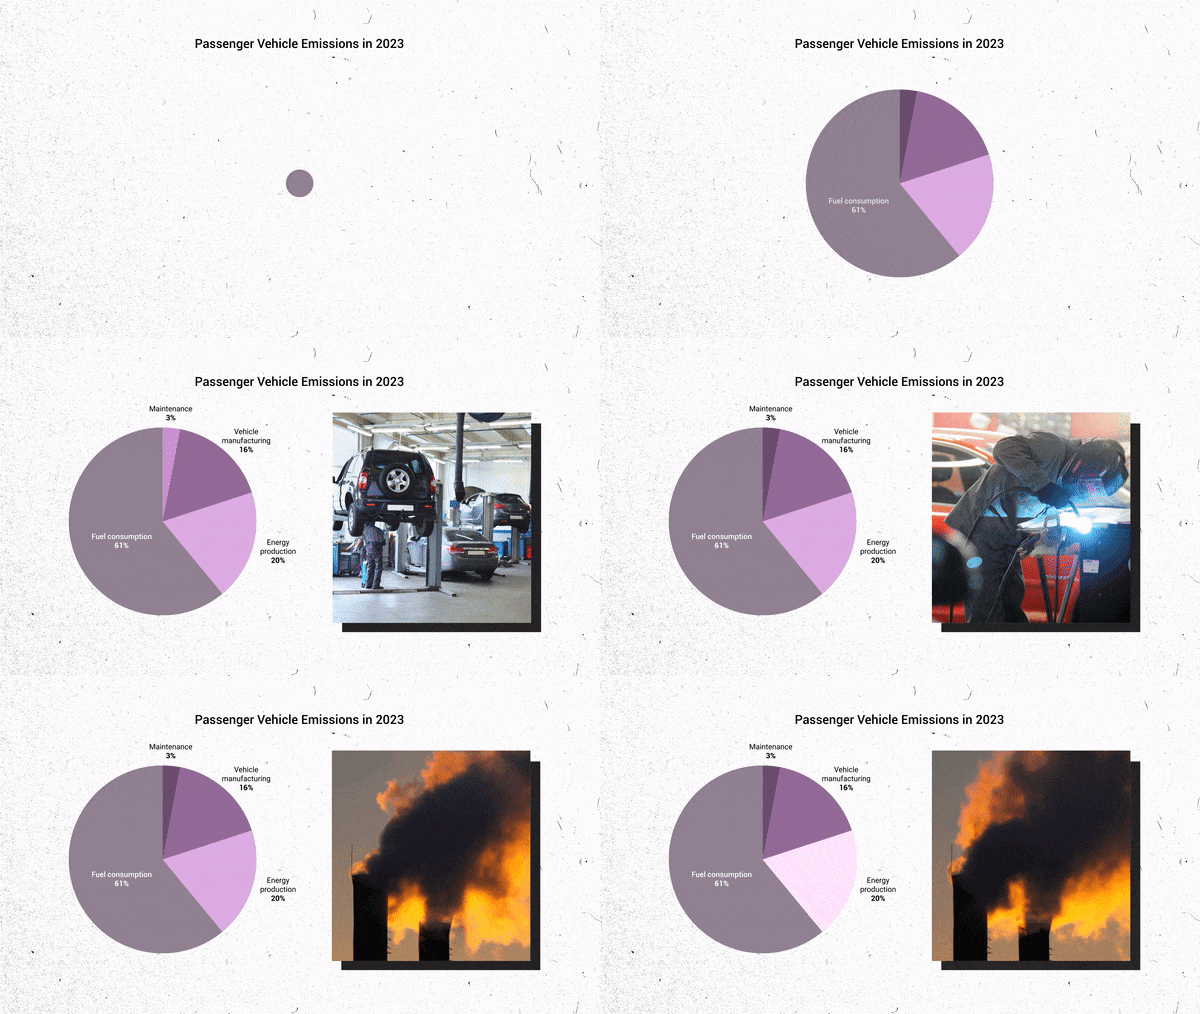
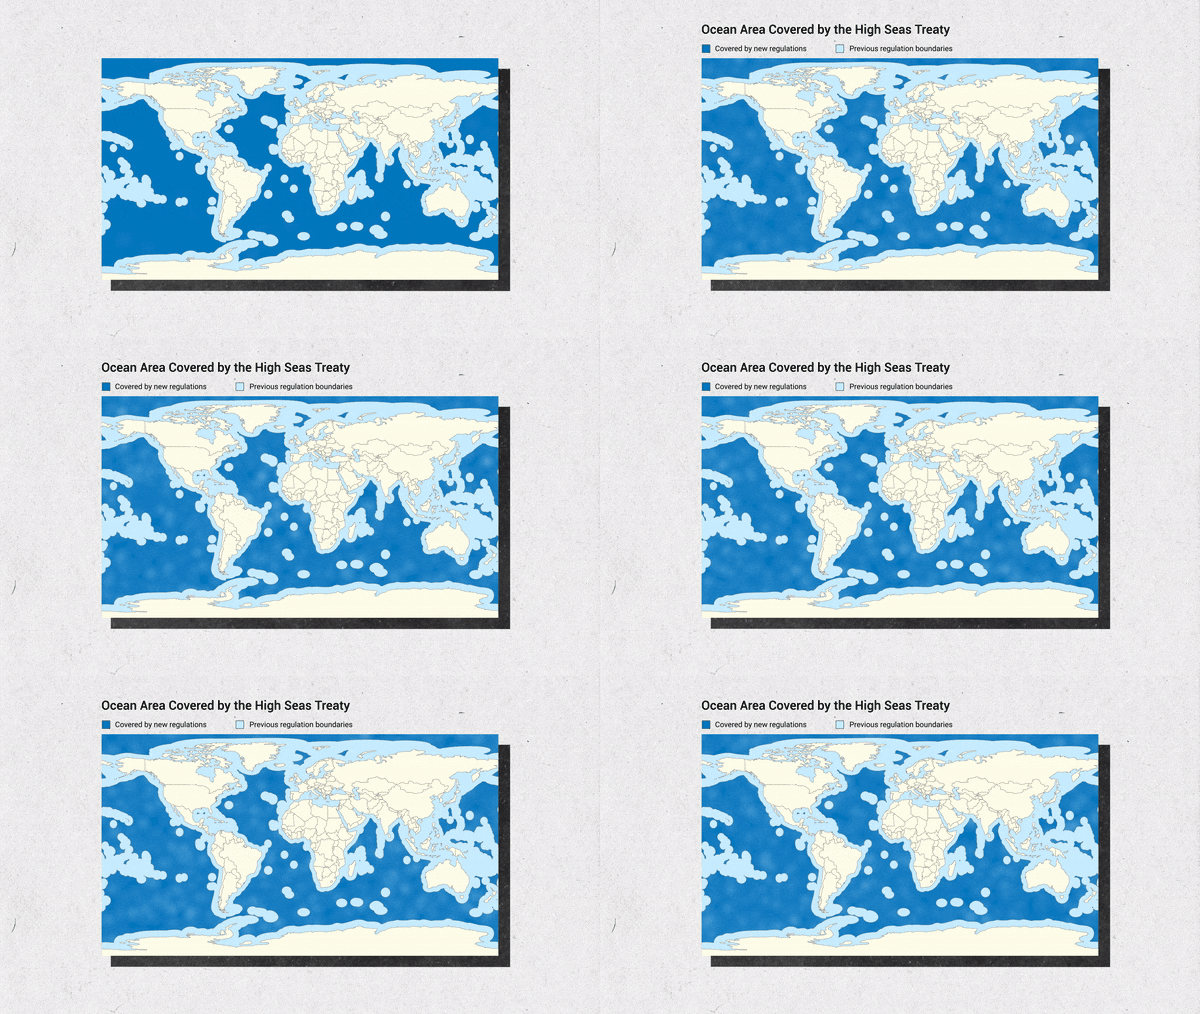
Charts, graphs, and infographics for GreenBiz’s climate explainer content
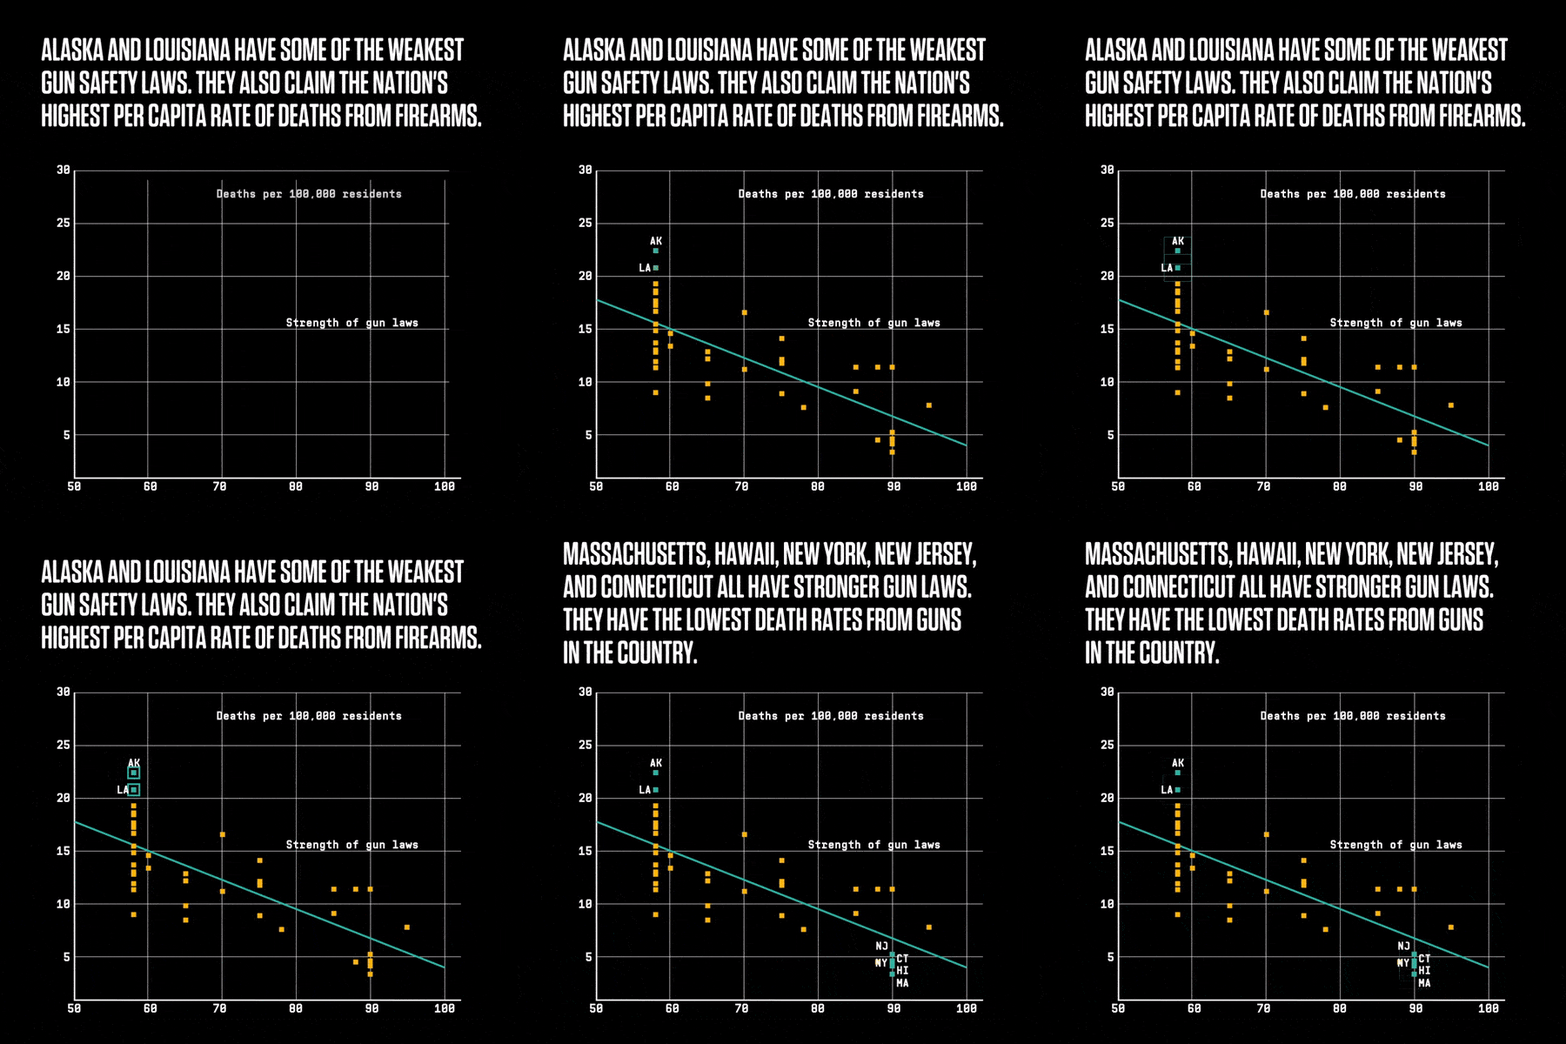
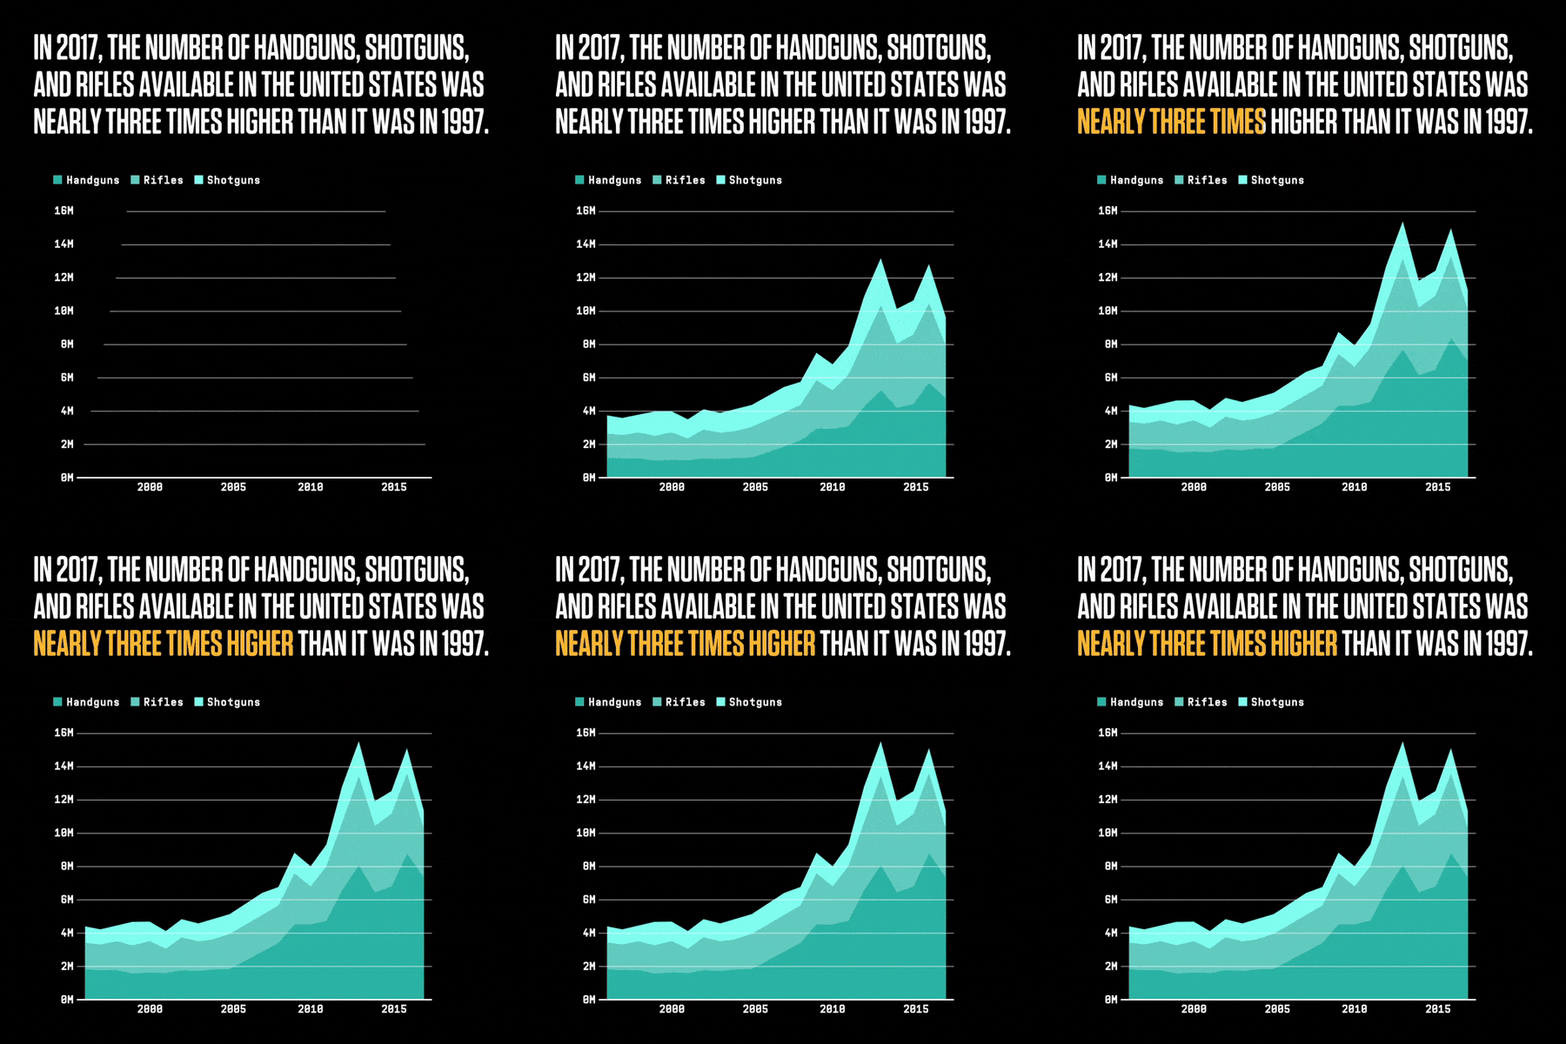
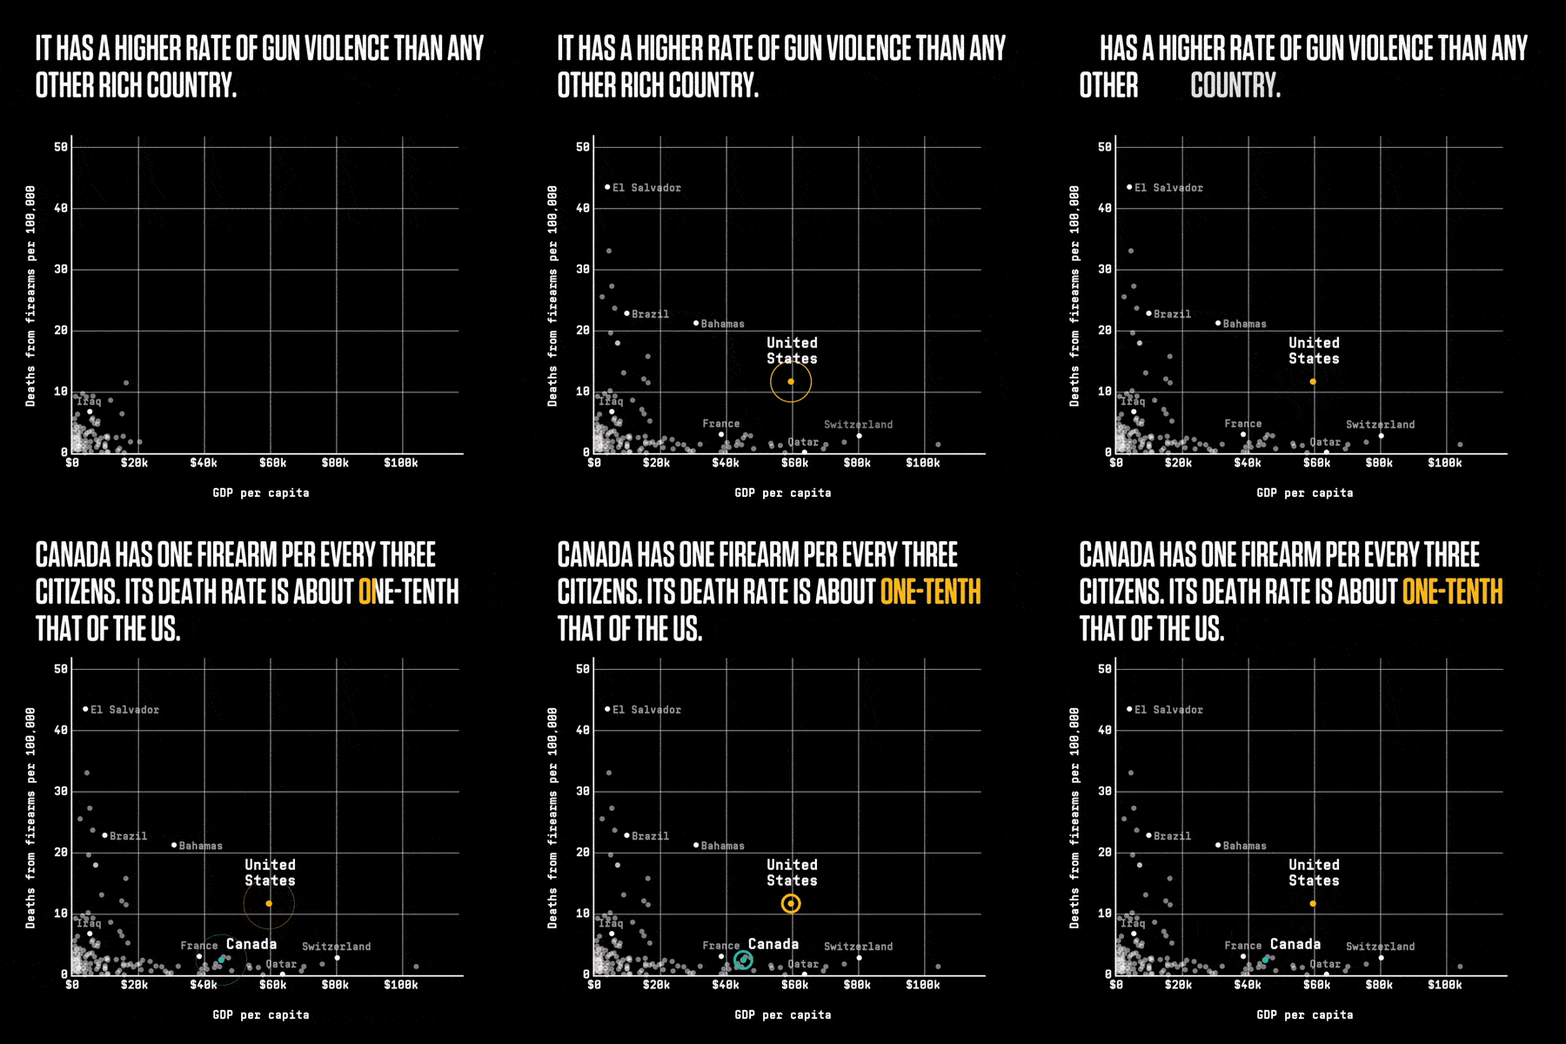
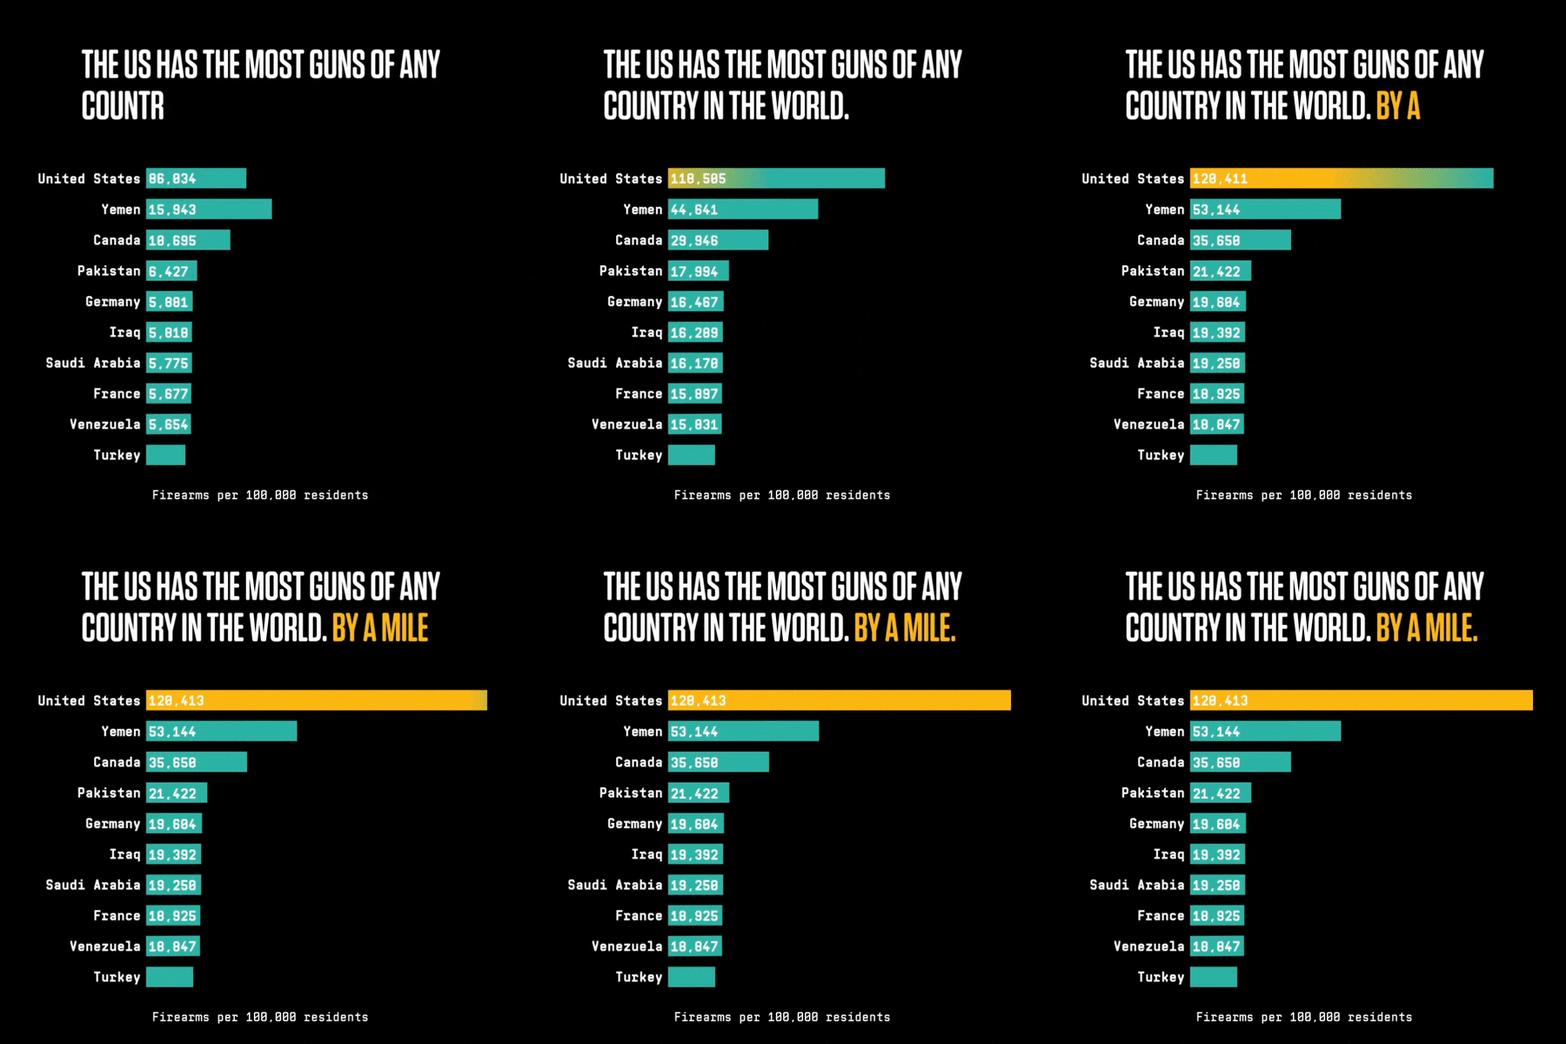
Used Datawrapper to build graphs and charts for a WIRED article about guns in America
TrendlineStacked Area ChartScatter PlotBar ChartInfographic charts for Citizens’ Climate Lobby
Stacked Area ChartBar ChartMap infographic for WIRED’s Urban Wildlife article
PrintOnlineHawaii Business Magazine ranks the top 250 state businesses every year. I managed, verified, and reorganized these large datasets for the 2008 list.
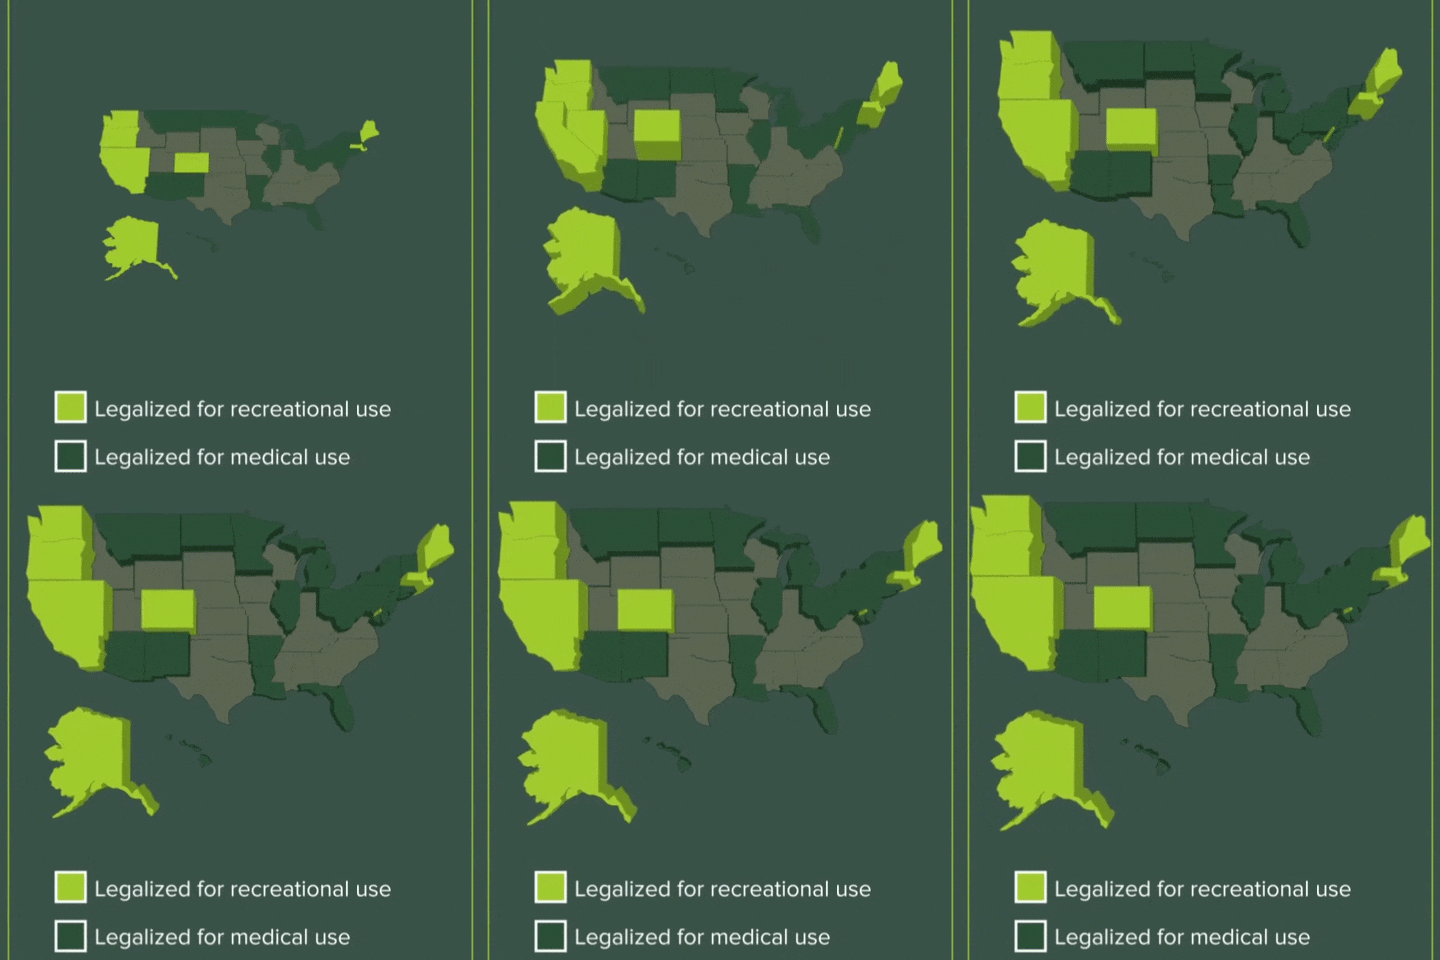
Example list from 2022, the year I worked on was not put onlineCannabis legalization map for WIRED
3D Choropleth MapScience lab exercise for Pearson
Interactive data table